

Bitcoin closed September up 6.33% while the S&P 500 went nowhere and gold fell more than 6%. Now it enters the month traders call Uptober. The historical record is striking. Claude AI Predicts BTC holds its current structure into the month, though the seasonal statistic is weaker than it looks, and ETF flows have already turned negative.
BTC trades near $83,423, down 0.23% on the day, and October has opened flat at -0.06%. October has averaged an 18.49% gain for Bitcoin since 2013, with a median of 12.73%, the strongest month on the calendar.

BTC SPX GOLD
Why Did Bitcoin Beat Both Stocks and Gold?
Because it stopped trading like either of them. Santiment data shows Bitcoin rose about 7% over the past five weeks while the S&P 500 managed just 0.3% in September. Gold went the other way entirely, falling 6.5%.
That divergence matters more than the percentages. For most of 2026, Bitcoin moved as a leveraged version of tech stocks or a junior partner to gold. In September, it did neither.
The quarterly chart reinforces the point. Q3 closed with a candle that engulfed every dollar of Q2 price action, erasing a full quarter of decline in three months.
Bitcoin gained 7.36% in July, 24.95% in August, and 6.33% in September. Three consecutive positive months, something it had not managed since 2025.
Does October Really Deserve Its Reputation?
Partly, and the caveat is worth more than the headline. The 18.49% average is real, but it is inflated by Bitcoin’s early years. October 2013 returned 60.79%, and October 2017 delivered 47.81%, both from a far smaller and less liquid market.
Strip those out, and the picture moderates. The median of 12.73% is the better guide, and recent years have been mixed: October 2024 gained 10.76%, while October 2025 fell 3.69%. Three of the last thirteen Octobers were negative. The month is favorable, but not guaranteed.
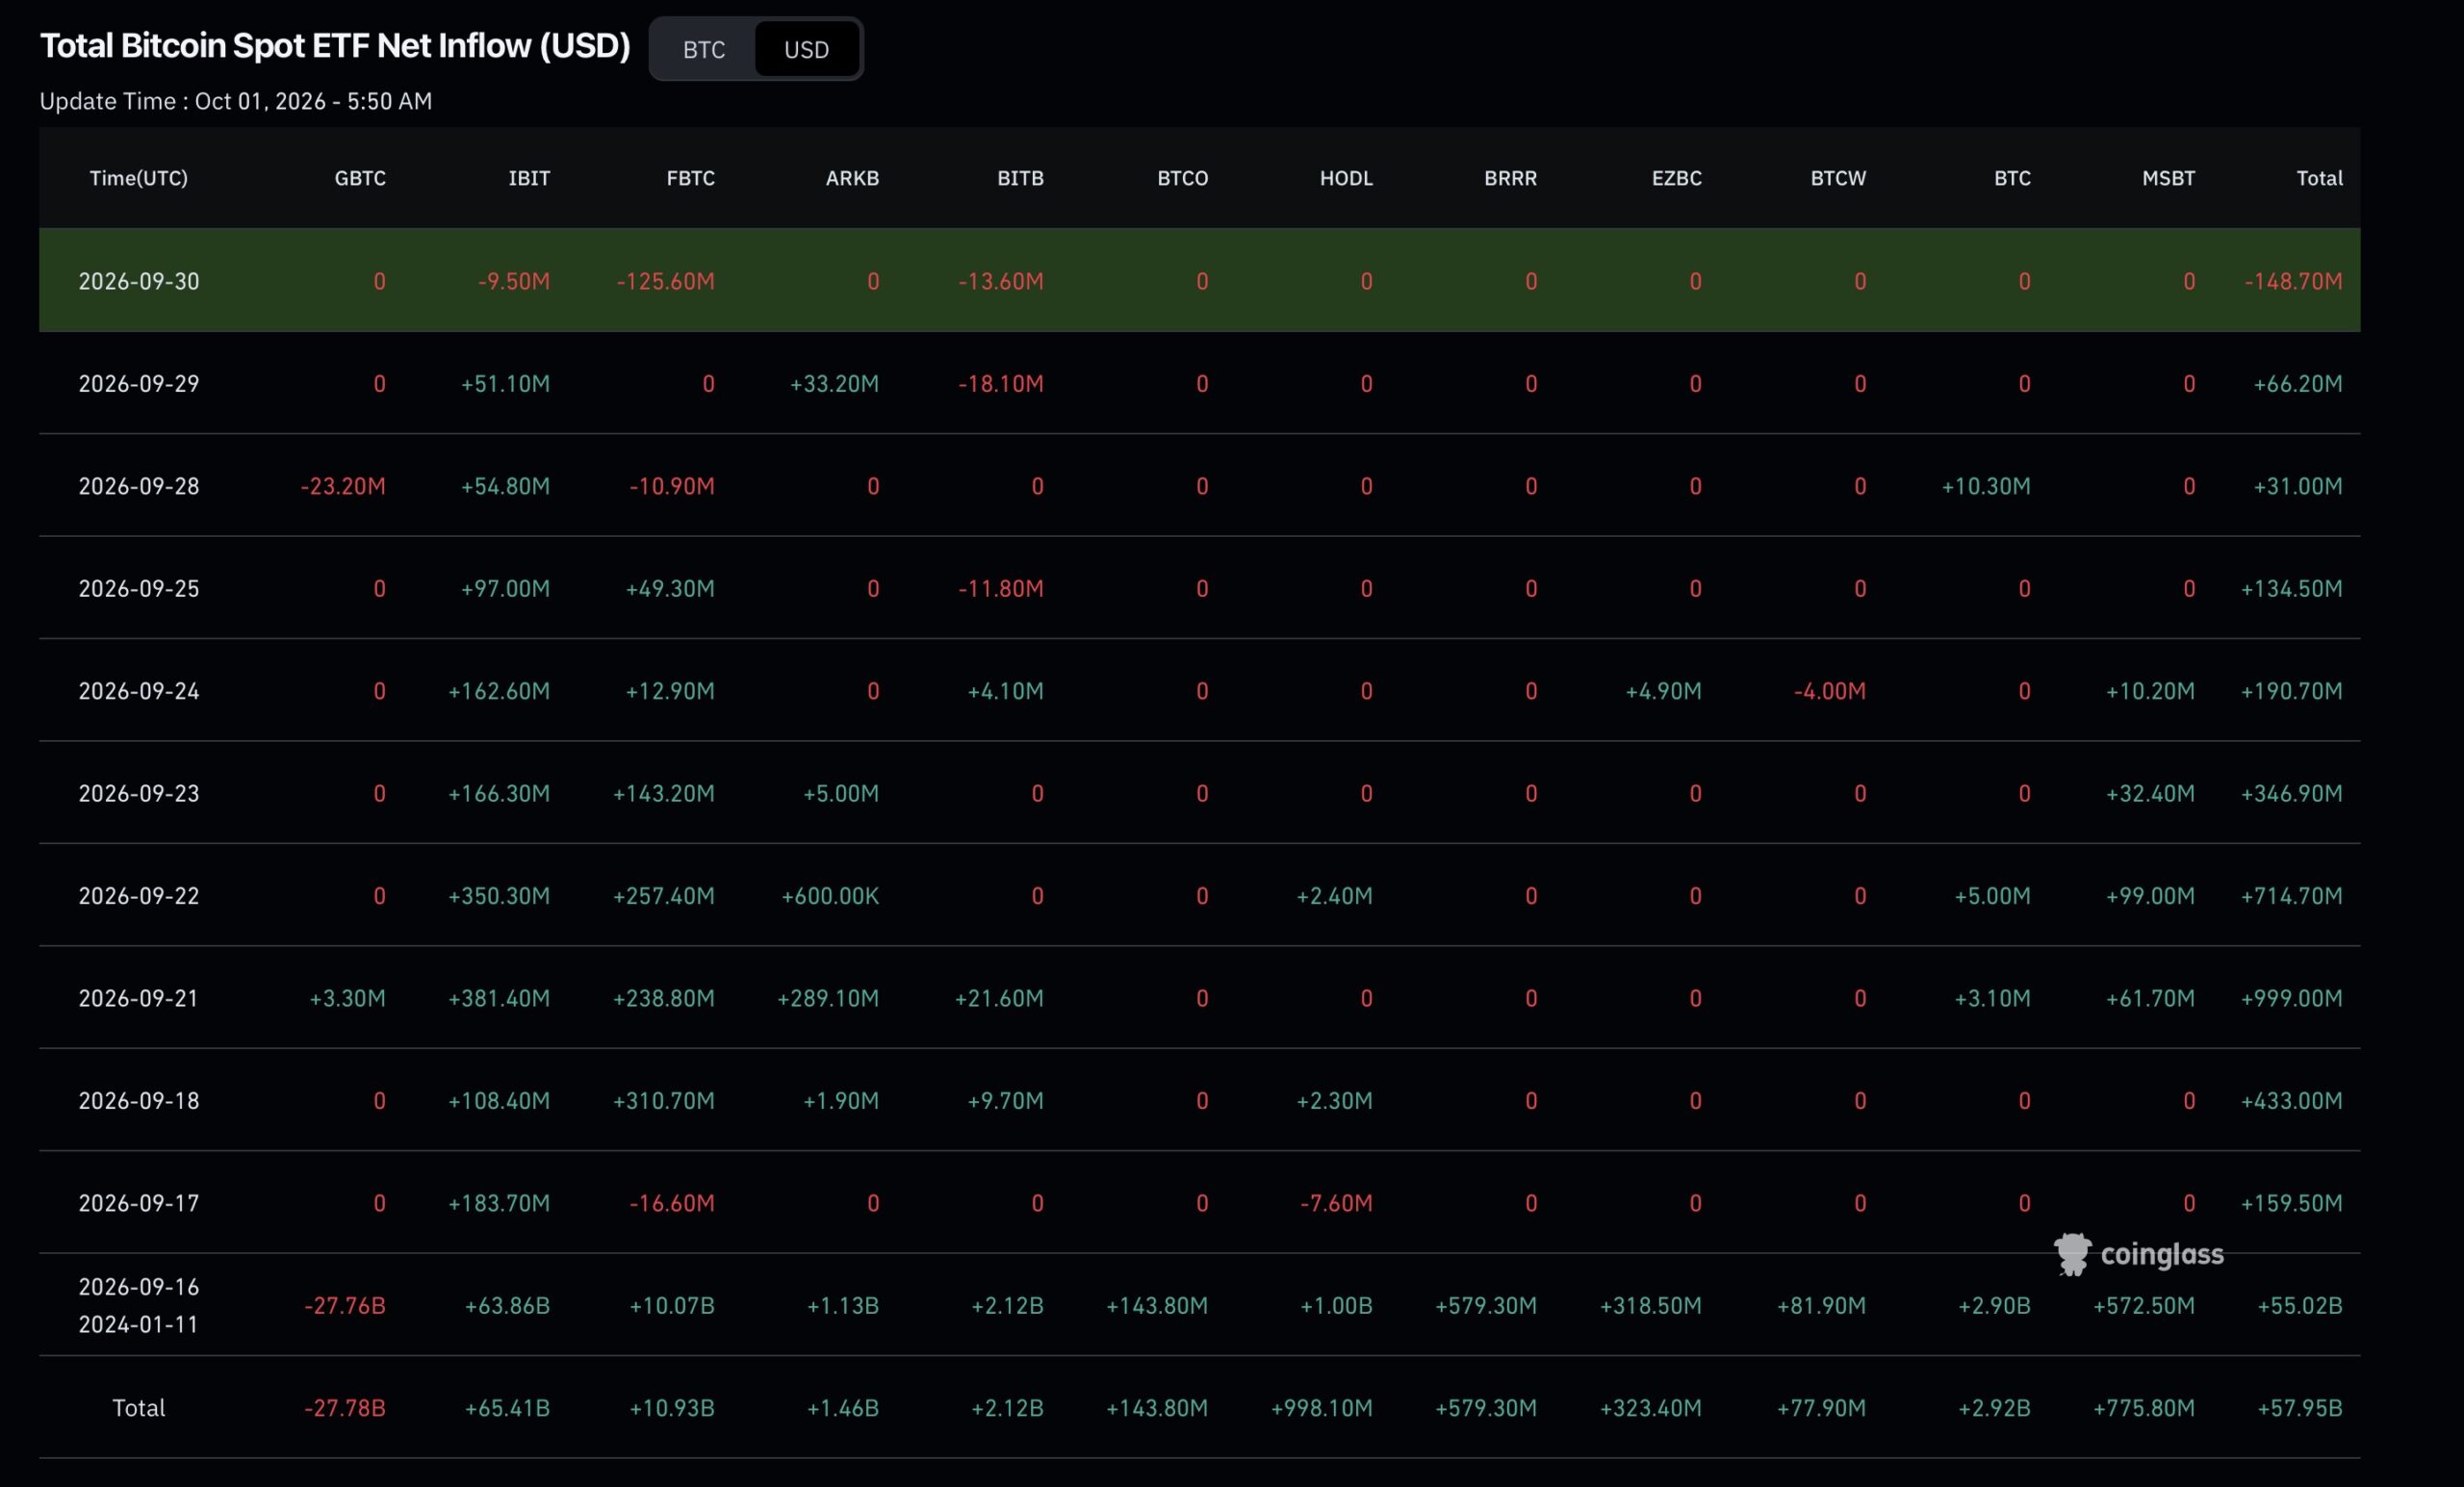
There is also a present-tense warning. US spot Bitcoin ETFs recorded a net outflow of $148.7 million on September 30, the first meaningful negative day in two weeks, led by $125.6 million leaving Fidelity’s FBTC.
BTC ETF Flows
That follows a steady decline in daily inflows, from $999 million on September 21 to $346.9 million, then $190.7 million, then $134.5 million. Momentum was fading before the outflow arrived. Seasonality describes what usually happens. Flows describe what is happening.
AI Predicts BTC Levels: What Could Spoil Uptober?
BTCUSDT Chart 1D
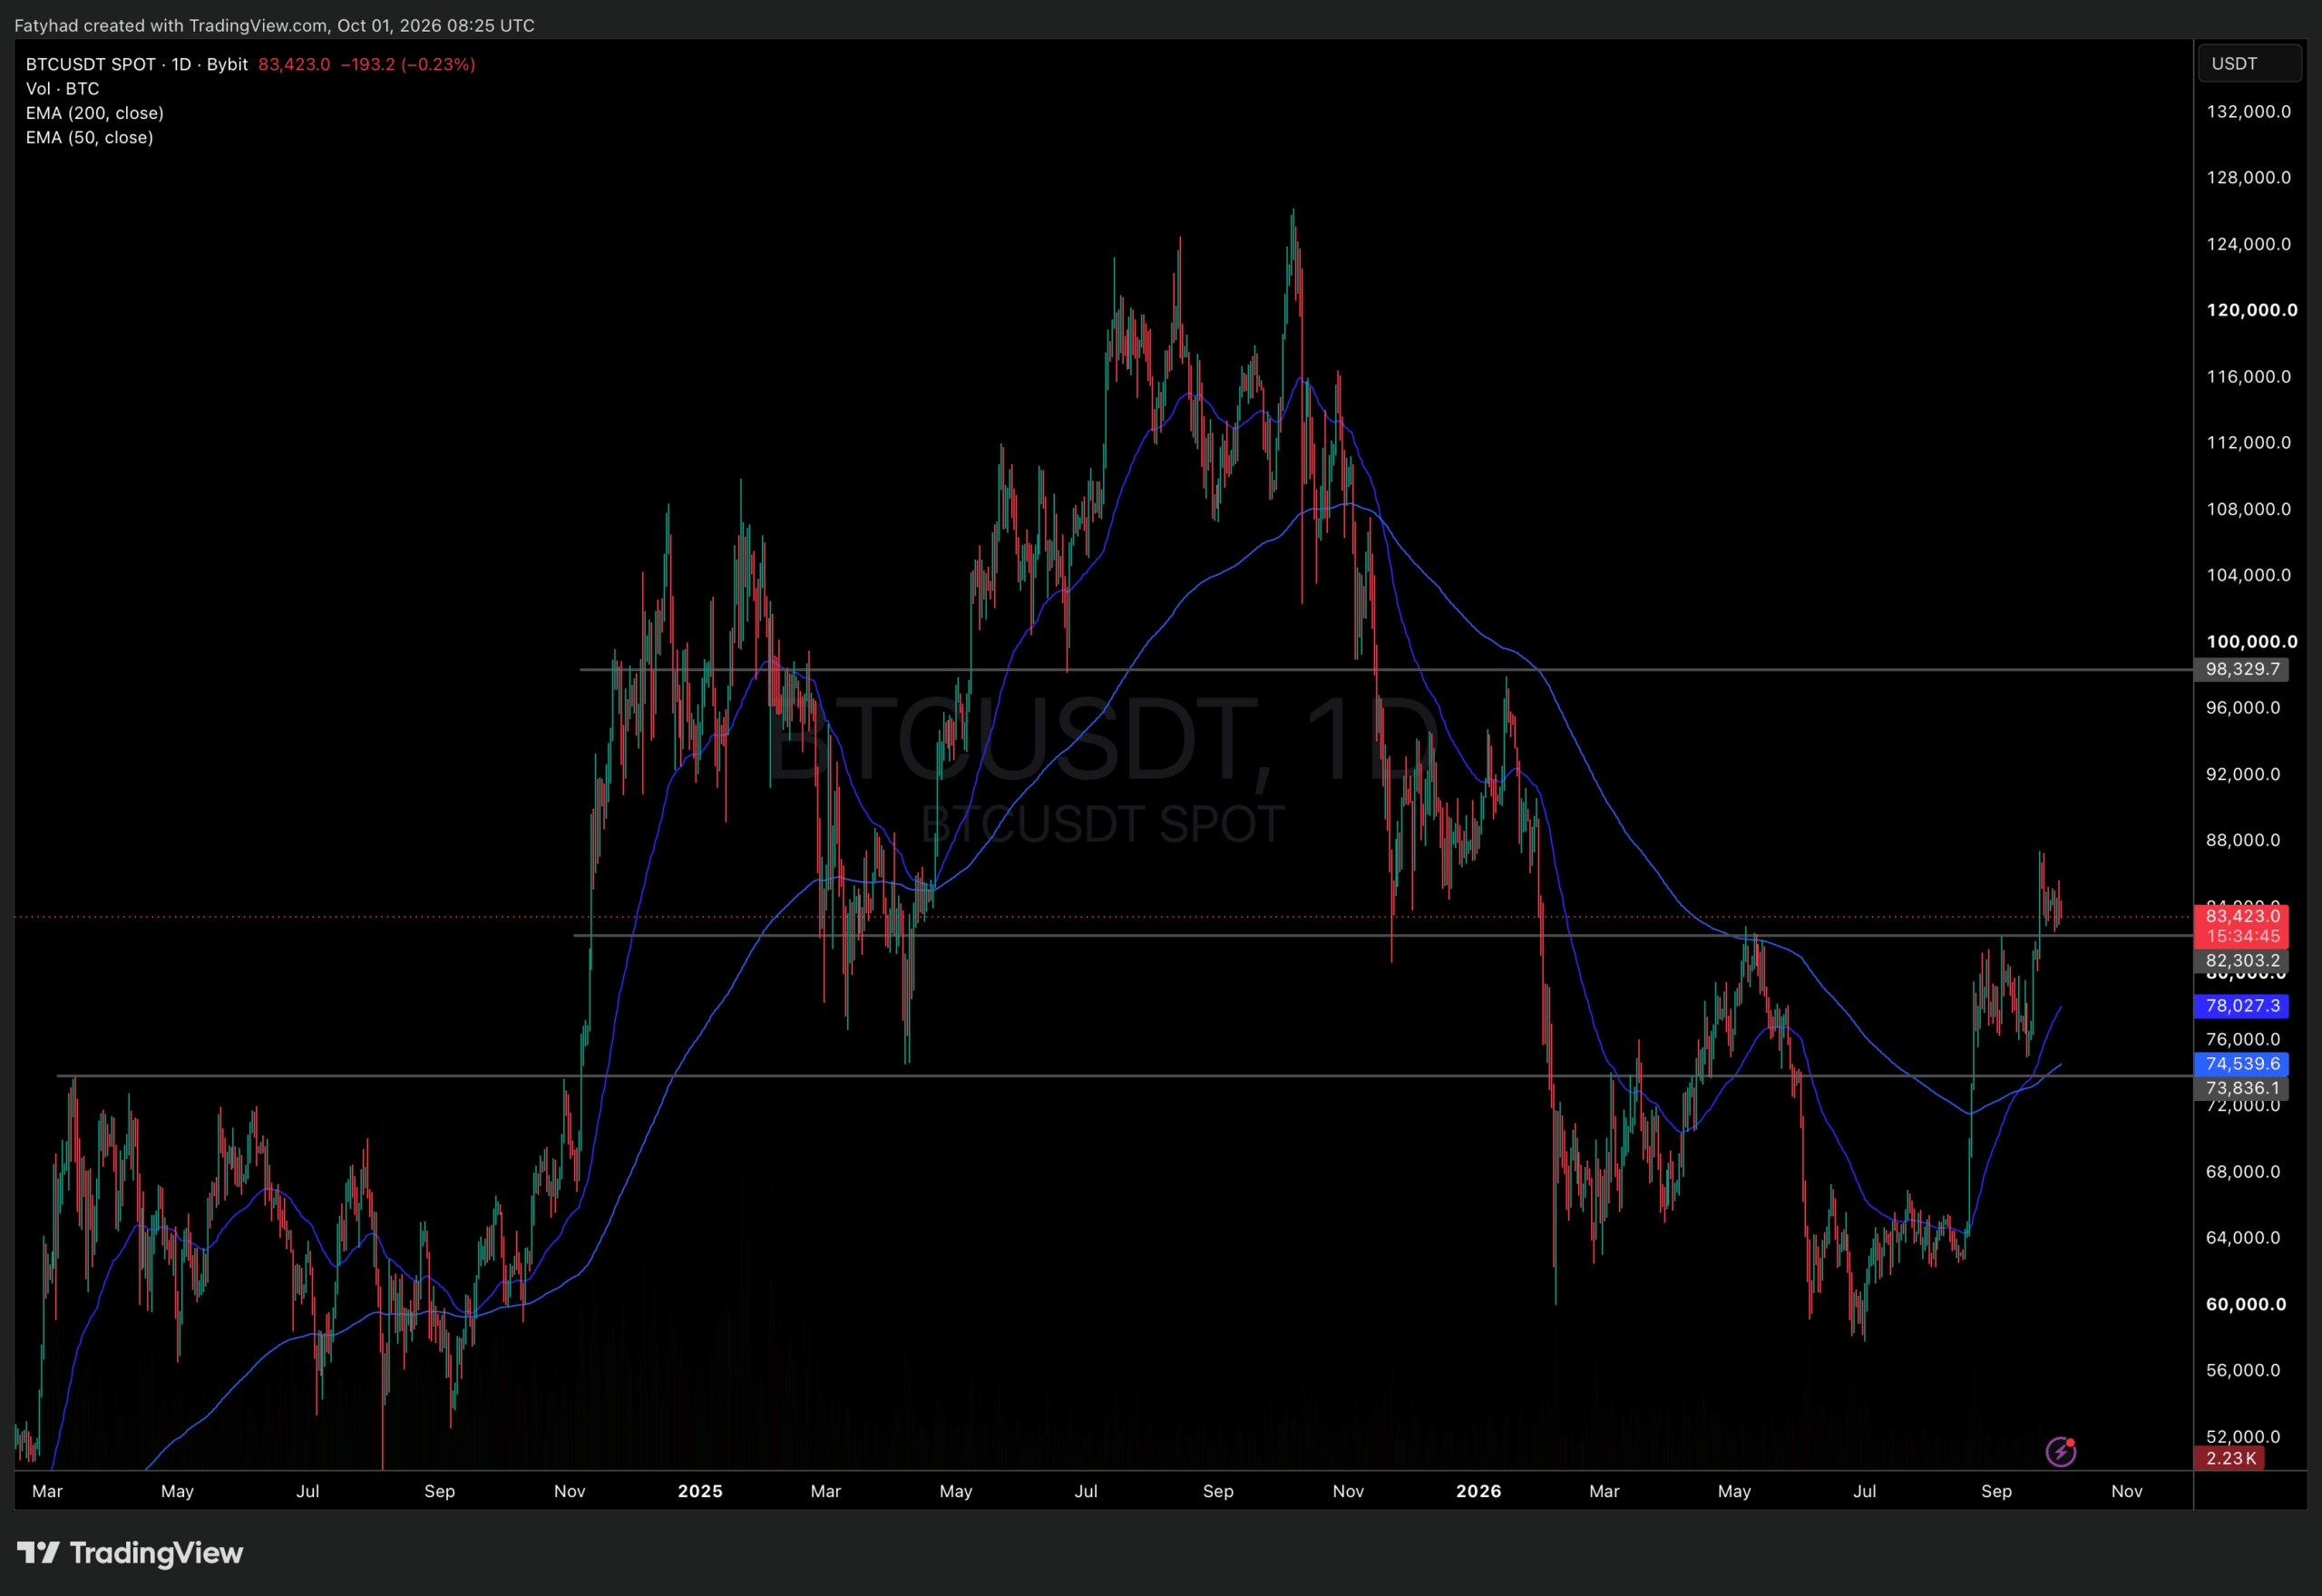
The chart is intact, which gives the seasonal case something to build on. Bitcoin holds above $82,303, the level that rejected it twice this year and now acts as support. The 50-day EMA at $78,027 sits above the 200-day EMA at $74,540, with both rising.
AI Predicts BTC will be decided at these levels:
- The line to hold: $82,303. Daily closes above it keep the quarterly breakout valid.
- The first test: $88,000 to $90,000. The nearest supply band, and the level any genuine October rally has to clear early.
- The target: $98,330. The last barrier before $100,000, and roughly what a median October would deliver from here.
Below the breakout, $78,027 and then $74,540 form the backstop, with $73,836 beneath.
Here is the useful framing. A median October move of 12.73% from $83,423 lands near $94,000. An average move reaches close to $99,000. Both are plausible from this structure.
But the month opening flat with ETFs selling is not how strong Octobers typically begin. If outflows continue into next week, the seasonal argument weakens considerably.
Watch the flows before trusting the calendar.


