- PUMP has cleared a long-term resistance zone after months of recovery, shifting the weekly structure toward a possible breakout phase.
- The token recovered sharply from its intraday low, but sellers remain active near the latest upper trading range and resistance levels.
- A hold above former resistance could support the breakout, while losing $0.00640 would reopen lower intraday support zones again soon.
PUMP is testing a major technical transition after months of recovery, with weekly resistance giving way while short-term trading remains caught between nearby support and resistance levels today.
Weekly Structure Moves Beyond Resistance
More Crypto Online described the move as a break above resistance. The weekly structure shows months of compression before this latest advance. Price now sits above a barrier that previously rejected several rallies.
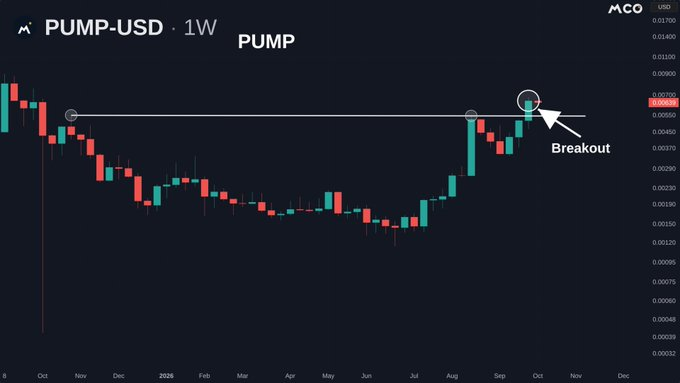
The broader decline produced repeated lower highs across the weekly chart. That weakness eventually slowed near the lower $0.001 region. Smaller candles then formed a lengthy base through mid-2026.
Recovery gained traction as higher lows appeared during the summer. Upward candles expanded as buyers carried price toward the resistance zone. The move later accelerated sharply during July and August.
The marked barrier had already influenced price during an earlier rally. Sellers previously forced price lower after reaching that same area. Therefore, the latest return carried greater technical importance.
Breakout Needs Confirmation Above the Barrier
The latest weekly candle moved above the established horizontal resistance. The displayed chart places that breakout near $0.00639. The move changes the structure from resistance testing toward possible support.
However, the weekly chart has not shown prolonged trading above resistance. That leaves the breakout dependent on continued acceptance above the former ceiling. Further weekly candles will show whether buyers can defend the reclaimed area.
A successful retest could turn the former ceiling into support. That would preserve the sequence of higher lows formed during recovery. It would also keep the broader breakout structure technically intact.
The current intraday chart shows a separate battle around nearby levels. The latest reading places PUMP near $0.006459, up 0.88% over 24 hours. Market capitalization stands near $2.99 billion, with volume around $338 million.
Intraday Levels Define the Next Test
The session began near $0.00647 before sellers pushed price lower. The decline reached approximately $0.00622 during the morning. That move established the session low before buyers returned.
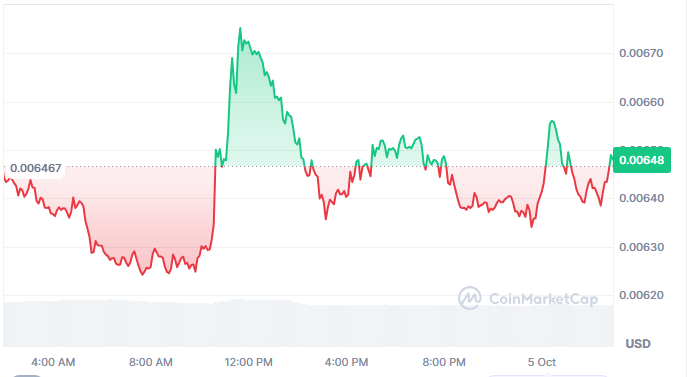
Buying then accelerated around midday, sending the price through $0.00640. The rebound continued above $0.00660 before reaching roughly $0.00670. Sellers responded there, producing a clear reversal toward lower levels.
Price later stabilized around $0.00640 and moved sideways. Several rebounds reached approximately $0.00650 before sellers returned. This created a narrower range after the earlier volatility.
The latest data shows volume down 7.98% despite the daily gain. Circulating supply is listed near 464.33 billion tokens. Maximum supply stands at one trillion tokens.
The $0.00640 area has repeatedly attracted buyers during recent trading. Meanwhile, $0.00650 to $0.00656 has continued attracting sellers. A sustained move above $0.00656 would strengthen the short-term recovery structure.