The blue vertical measurement is the most aggressive part of the setup: if $XRP ever repeated the percentage expansion that followed its 2017 breakout, the move would extend into the hundreds of dollars.
The chart snapshot places $XRP around $1.3758, while current CoinMarketCap data has the asset near $1.39.
On the weekly candle shown, $XRP opened near $1.5203, traded as low as $1.3188, and was down roughly 9.5% at the time of the snapshot.
What the Blue $XRP Line Actually Represents
The blue measurement is not simply adding the dollar amount $XRP gained in 2017.
It is copying the percentage magnitude of the old bull run onto the newer structure.
The Crypto Basic previously tracked $XRP’s historic move from around $0.005 in March 2017 to $3.31 in January 2018, an increase of roughly 66,000%.
That works out to an ending price roughly 662 times the starting level.
The latest chart places another blue vertical measurement over the current cycle, beginning around the recent $0.95-$1.00 region.
Applying a similar 662x expansion from that area would mathematically produce roughly $630-$660 $XRP.
That is why the top of the blue projection reaches the neighborhood of $650 on the logarithmic scale.
This is a historical-repeat calculation, not evidence that $XRP will actually reproduce a 66,000% rally.
Blue Line $XRP Targets Shown on the Long-Term Chart
The chart maps several upside reference levels if $XRP eventually breaks from its current compression.
The first major area is the previous cycle-high region around $3-$3.60, which price would need to reclaim before the larger projections become relevant.
Beyond that, the logarithmic channel places higher reference zones around $12 and $165.
The main green projection then extends toward roughly $650, which represents the chart’s equal-magnitude comparison with $XRP’s 2017 bull run.
An even higher blue channel rail appears around the $1,300 region as the structure extends into 2027, although this is a long-term channel reference rather than a confirmed price objective.
For now, those distant levels remain secondary. $XRP first needs to defend its macro support and clear the descending resistance sitting much closer to current price.
$XRP Is Still Compressing Near Long-Term Support
The more immediate structure is far less dramatic.
A red ascending trendline runs underneath $XRP’s long-term price action, while a descending turquoise trendline from the 2025 highs continues to press down from above.
Those two lines are converging into late 2026 and early 2027, leaving $XRP inside another tightening structure.
The recent low near the $0.95-$1.00 region is therefore important. It sits close to the rising macro trendline and serves as the base from which the blue historical comparison is measured.
Closer to the current price, this week’s $1.3188 low provides the first support visible in the latest candle.
A decisive break below the rising red trendline and the recent sub-$1 area would damage the setup because $XRP would lose the structural base used for the projected repeat.
$XRP Still Has Major Resistance Before Any Historic Repeat
The chart also makes clear that $XRP would not move directly from $1.39 into triple-digit territory.
The descending turquoise resistance line is the first hurdle. Above that, $XRP would still need to recover the 2025 peak region around $3.5-$3.6 before entering genuine price expansion beyond the previous cycle highs.
The broader chart includes several parallel blue ascending rails on the logarithmic scale.
These appear to provide long-term channel references rather than clearly labeled standalone targets.
The projected green path rises sharply only after the current compression resolves, eventually approaching the upper end of the copied 2017 move.
So while the blue line draws attention because of its scale, the current technical question is much simpler: can $XRP defend the $1 area and break out of the tightening weekly structure?
Without those steps, the equal-magnitude comparison remains only a historical scenario.



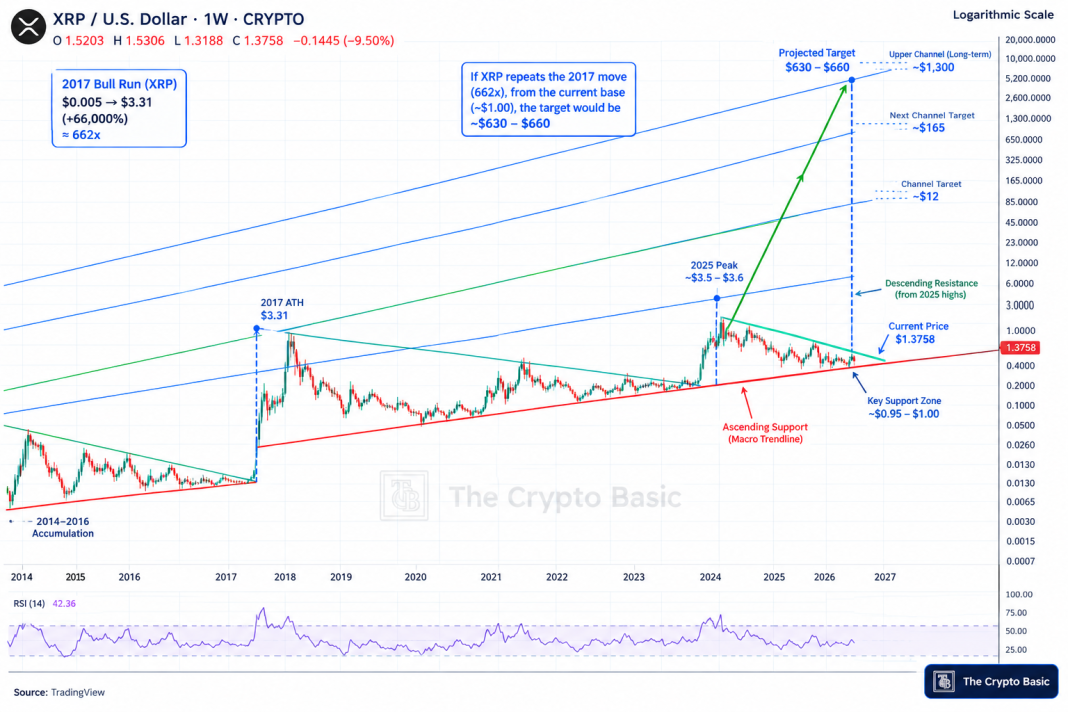 $XRP’s weekly chart uses a blue vertical measurement to compare the current structure with the historic 2017-2018 bull run. Repeating the roughly 66,000% expansion from a base near $1 would mathematically place the upper projection around the $650 region, while
$XRP must first hold macro support and clear descending resistance.
$XRP’s weekly chart uses a blue vertical measurement to compare the current structure with the historic 2017-2018 bull run. Repeating the roughly 66,000% expansion from a base near $1 would mathematically place the upper projection around the $650 region, while
$XRP must first hold macro support and clear descending resistance.