Bitget App
Trade smarter
Buy cryptoMarketsTradeFuturesStocksEarnInstitutionAI & More
Will XRP Price Break Above $1.65 to Confirm the Bottom Is In

Will XRP Price Break Above $1.65 to Confirm the Bottom Is In

CryptoNewsNetCryptoNewsNet2026/10/22 14:54
By:CryptoNewsNet
Back to the list

Will XRP Price Break Above $1.65 to Confirm the Bottom Is In

Will XRP Price Break Above $1.65 to Confirm the Bottom Is In image 0  thecryptobasic.com 29 m
Will XRP Price Break Above $1.65 to Confirm the Bottom Is In image 1

$XRP analyst Casi Trades says $XRP must break above $1.65 to confirm its recent price bottom.

In a recent post on X, the analyst asked whether $XRP would break above $1.65, highlighting the price level as a confirmation point for a bullish reversal. She also pointed to a wick touching a key level on the chart, describing the move as a notable development.

However, Casi clarified that $XRP reaching $1.65 would not automatically confirm a bottom. The coin must break above the resistance level to provide the confirmation she is looking for.

The analysis comes as $XRP trades around $1.33 on the daily chart, following a decline from its recent peak near $1.65 in September. The chart shows the token struggling below a descending trendline, with the recent price action leaving the market at a critical point.

$XRP Holds $1.27 Support

Casi Trades previously highlighted $XRP’s reaction at $1.27, noting that the level aligned with a local 0.618 Fibonacci retracement and her Wave 2 target under Elliott Wave Theory.

According to the analyst, $XRP’s ability to hold that level was an encouraging initial sign that a bottom is forming. The token subsequently rebounded toward the $1.30 area, which she identified as the first local Fibonacci resistance.

The accompanying chart places the 0.118 Fibonacci retracement near $1.3040, with $XRP recently trading around $1.3343.

The Relative Strength Index (RSI) stands near 42.50, below the neutral 50 mark but above its recent lows. This suggests that bearish pressure has eased somewhat without confirming a bullish trend reversal.

Casi cautioned that bottoming is a process, not a single price event. $XRP could revisit the $1.27 support area several times before establishing a sustained recovery.

The chart also shows converging trendlines around $XRP’s recent price action, with the token falling below the earlier consolidation structure. The $1.27 area remains a level to watch as traders assess whether buyers can prevent another decline.
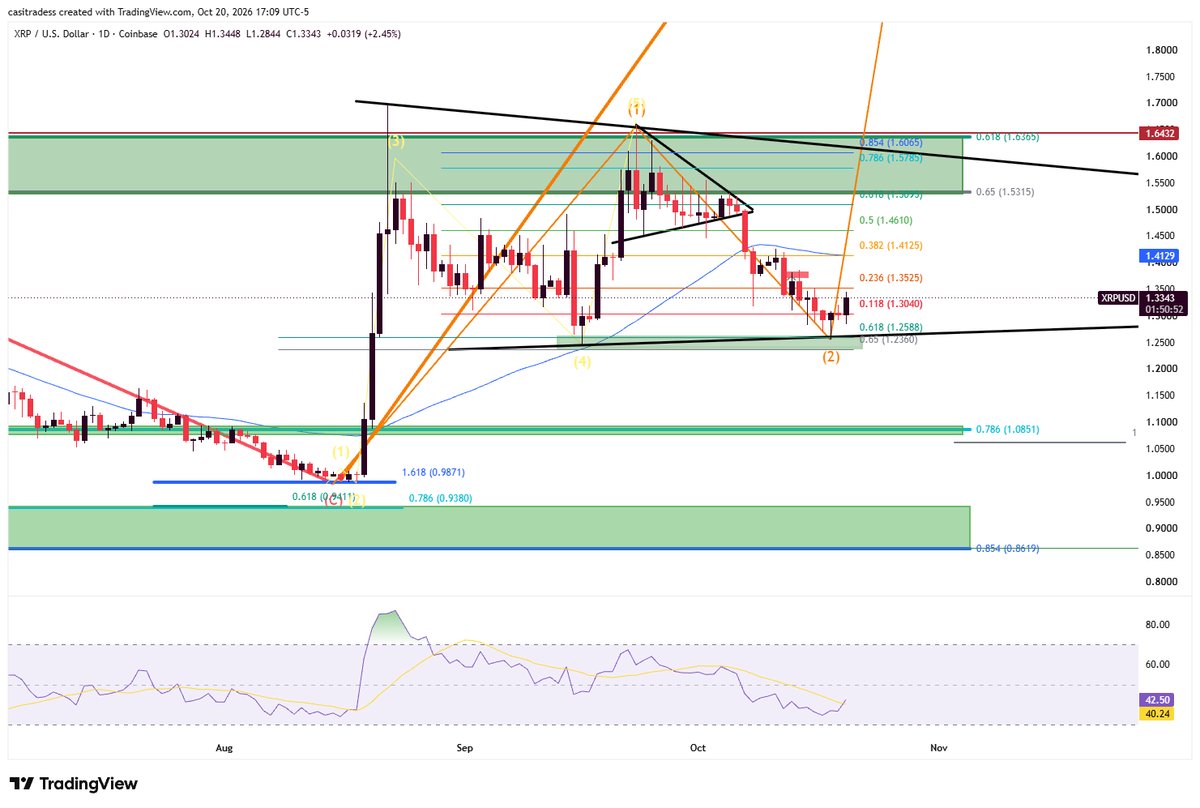
Will XRP Price Break Above $1.65 to Confirm the Bottom Is In image 2 $XRP Price 1-Day Chart with Elliott Wave Structures.

$XRP Break Above $1.65 Could Open Path to $2.40

Casi Trades identified $1.65 as the critical resistance level $XRP must overcome to confirm that its Wave 2 correction has ended.

In her Elliott Wave outlook, a successful break above this level would target $2.40 as part of a smaller Wave 3 advance. She views that move as confirmation that $XRP is transitioning into a larger bullish phase, with new all-time highs as the target.

The chart identifies additional Fibonacci levels between the current price and the $1.65 threshold. These include approximately $1.35, $1.41, $1.46, $1.53, and $1.58, which could present hurdles during a recovery.

In other words, $XRP must first reclaim these intermediate levels before challenging the key resistance zone. Even a move to $1.65 would not satisfy the analyst’s confirmation criteria if the price fails to break above it.

$XRP Risks $1.10 or $0.87 if Support Fails

Despite the potential for a bullish reversal, Casi Trades warned that $XRP’s downside targets remain in play if its previous low fails. She identified $1.10 as the next downside level, with $0.87 representing a deeper bearish target.

The chart also highlights a support region around $1.08 to $1.10 and a lower demand zone extending toward $0.87. Essentially, these areas would become relevant if $XRP loses the $1.27 level and selling pressure intensifies.

0
0

Disclaimer: The content of this article solely reflects the author's opinion and does not represent the platform in any capacity. This article is not intended to serve as a reference for making investment decisions.

Understand the market, then trade.
Bitget offers one-stop trading for cryptocurrencies, stocks, and gold.
Trade now!

You may also like

Tech capital pours into Hollywood! Musk reportedly invests $1 billion in Skydance - financial rescue or strategic deployment?

After the news broke, Skydance's share price rose as much as 7.5% intraday before turning negative, at one point falling more than 4%. Skydance's total debt is nearly $8.7 billion, and the $1 billion capital injection is far below previous market expectations, only enough to cover the company’s interest payments for one quarter. The credit market’s stress signals have not been alleviated. Each new “vote of confidence” may be interpreted as the company needing more funding. CDS market pricing indicates that investors expect larger-scale equity financing to follow.

华尔街见闻•2026/10/22 22:57

AI funding concerns reignite and Middle East tensions escalate! Nasdaq posts biggest single-day drop since June, international oil prices surge

Most U.S. stocks closed lower on Thursday as massive capital expenditures and financing pressures in the artificial intelligence (AI) sector once again triggered investor concerns, leading to a large-scale sell-off in technology stocks.

智通财经•2026/10/22 22:37
AI funding concerns reignite and Middle East tensions escalate! Nasdaq posts biggest single-day drop since June, international oil prices surge

Partial clinical trial data leaked! Moderna (MRNA.US) shares plunged as much as 25% as Wall Street says market expectations are too high

Moderna’s stock price plunged as much as 25% on Thursday after some clinical trial data of its personalized cancer vaccine, developed in collaboration with Merck, was leaked prematurely, triggering a sell-off by investors.

智通财经•2026/10/22 22:32