

- Ethereum’s symmetrical triangle suggests an imminent breakout as it nears resistance.
- Solana’s bullish structure indicates potential acceleration upon clearing key resistance.
- Market volatility rises as Ethereum and Solana approach critical technical thresholds.
Raoul Pal, founder of Global Macro Investor, pointed out that both Ethereum and Solana are approaching crucial price levels. These levels could signal major moves for both of these popular cryptocurrencies.
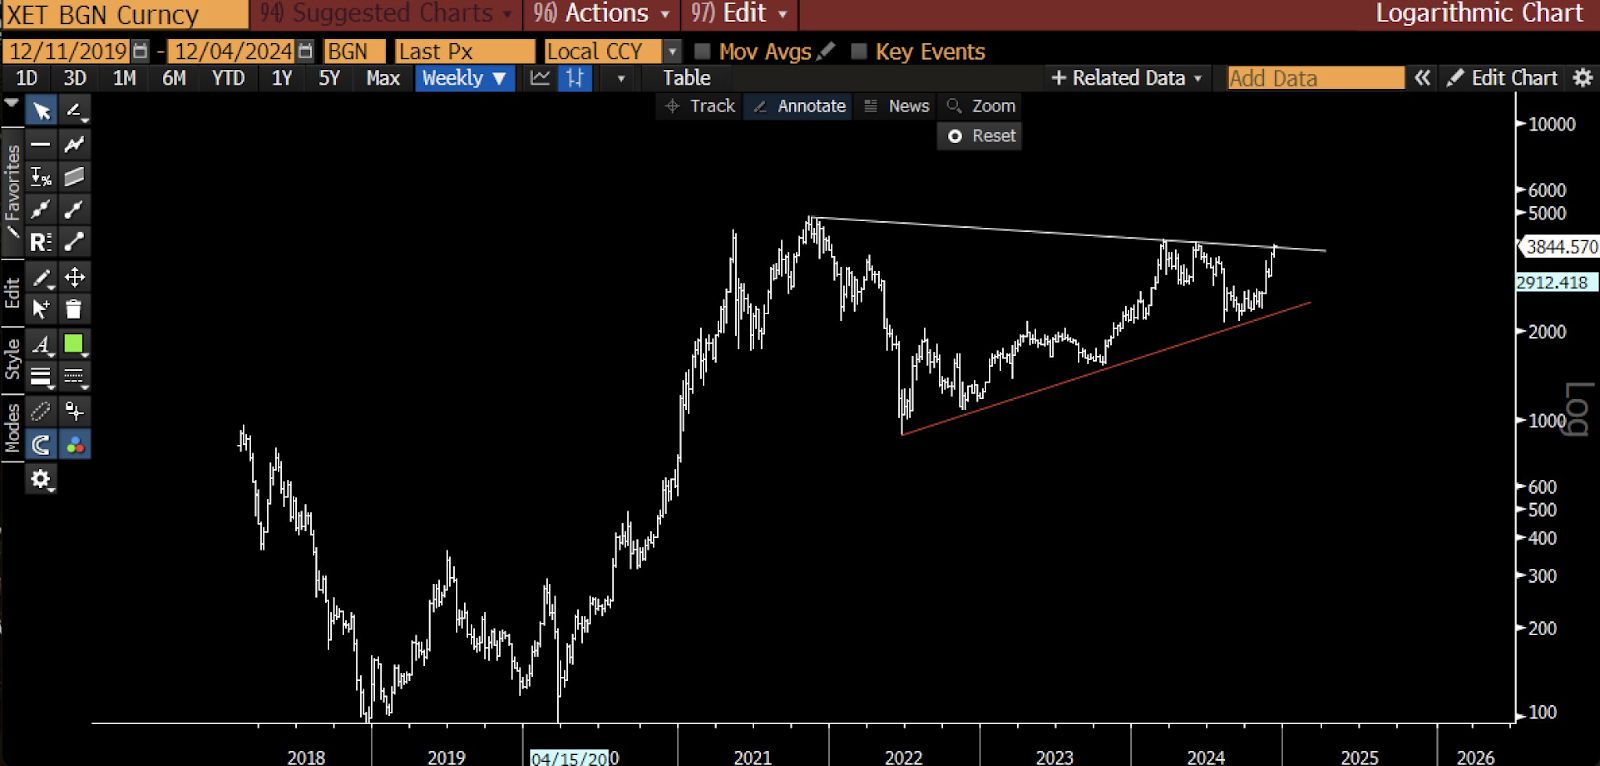
Ethereum’s price activity has formed a symmetrical triangle pattern on a logarithmic scale over several years. The price is currently near the apex of this formation, forming a series of higher lows against a descending resistance line.
 Source: X
Meanwhile, Solana’s chart shows a bullish long-term structure that is nearing horizontal resistance. Pal said they may see accelerated movement if both assets break above their current resistance levels. However, data shows a period of heightened volatility and mixed signals in short-term price changes.
Ethereum Chart Formation
A symmetrical triangle is evident on the Ethereum (ETH) chart. This pattern consists of rising support, represented by a red upward-sloping trendline, and a downward-sloping white trendline acting as resistance.
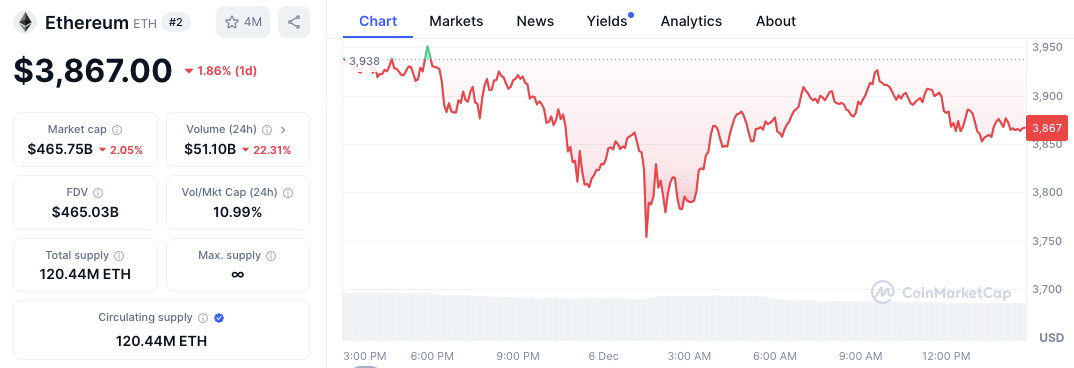
As of the latest observations, Ethereum’s price is hovering near the apex of this triangular structure. The asset previously approached a local high of $3,938 before experiencing a pullback. Recent data placed ETH at around $3,867, down 1.86% in the last 24 hours.
 Source: CoinMarketCap
Additionally, its market capitalization fell 2.05% to about $465.75 billion. Moreover, trading volume decreased by 22.31% to $51.10 billion.
Solana Resistance Levels
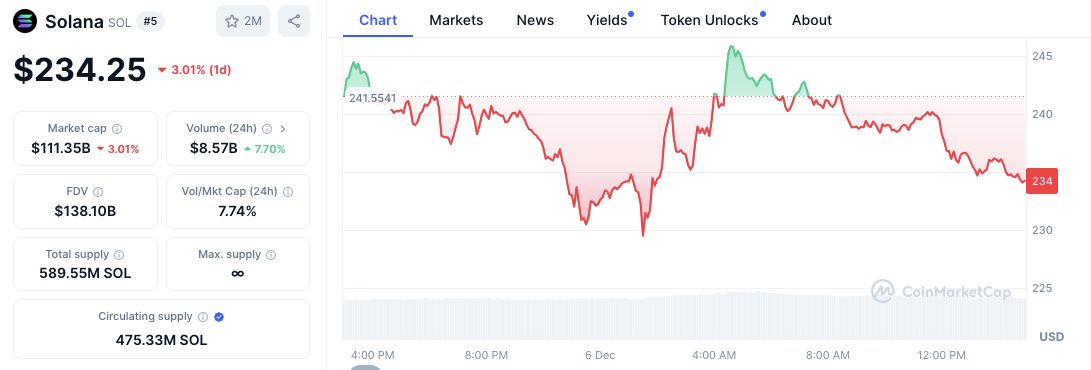
Solana (SOL) shows a chart pattern highlighting an ongoing bullish trend. The price recently hovered around $234.25, down 3.01% over the previous day. A horizontal resistance level sits near $268, coinciding with an earlier peak.
 Source: CoinMarketCap
Over the same 24-hour period, its trading volume rose 7.70% to $8.57 billion. The asset’s circulating supply was around 475.33 million SOL out of a total of 589.55 million.
Disclaimer: The information presented in this article is for informational and educational purposes only. The article does not constitute financial advice or advice of any kind. Coin Edition is not responsible for any losses incurred as a result of the utilization of content, products, or services mentioned. Readers are advised to exercise caution before taking any action related to the company.


