
A Chart Overview of Commodity Support and Resistance: Gold, Silver, Oil, Gas + Platinum, Palladium, Copper, and Agricultural Futures (May 22, 2026)

FX168 News on May 22—— An overview of commodity support and resistance in one chart: gold, silver, oil, gas + platinum, palladium, copper + agricultural product futures, updated on Friday, May 22, 2026 at 08:45 (UTC+8). Specifically covers 14 varieties including gold, silver, platinum, palladium, copper + crude oil, natural gas, fuel oil + wheat, corn, cotton. For more details, refer to the customized charts by FX168 Financial Analysis.
An overview of commodity support and resistance in one chart: gold, silver, oil, gas + platinum, palladium, copper + agricultural product futures, updated on Friday, May 22, 2026 at 08:45 (UTC+8). Specifically covers 14 varieties including gold, silver, platinum, palladium, copper + crude oil, natural gas, fuel oil + wheat, corn, cotton. For more details, refer to the customized charts by FX168 Financial Analysis.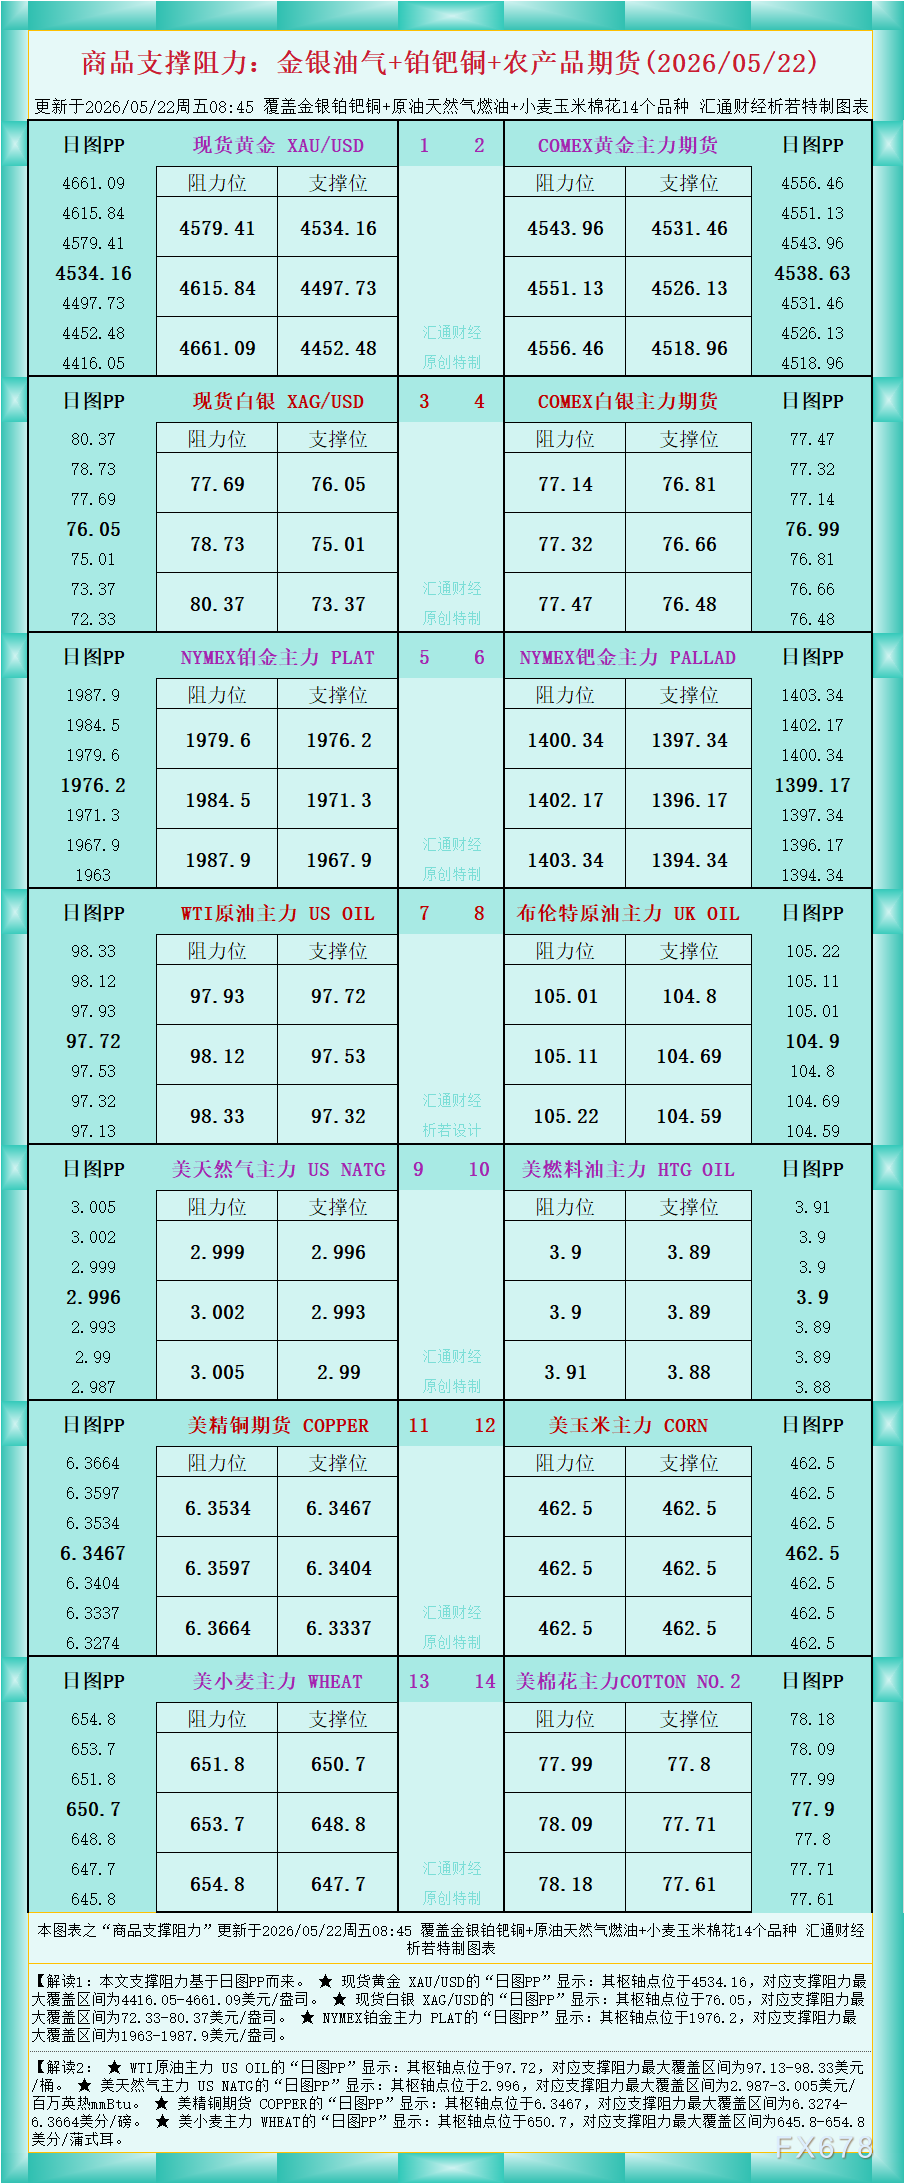
According to the data shown in the figure, Interpretation 1: The support and resistance in this article are based on daily chart PP (Pivot Point).
★ For spot gold XAU/USD, the “Daily Chart PP” shows a pivot point at 4534.16, with the maximum support and resistance range covering $4416.05–4661.09/oz.
★ For spot silver XAG/USD, the “Daily Chart PP” shows a pivot point at 76.05, with the maximum support and resistance range covering $72.33–80.37/oz.
★ For NYMEX platinum PLAT, the “Daily Chart PP” shows a pivot point at 1976.2, with the maximum support and resistance range covering $1963–1987.9/oz.
Interpretation 2:
★ For WTI crude oil US OIL, the “Daily Chart PP” shows a pivot point at 97.72, with the maximum support and resistance range covering $97.13–98.33/barrel.
★ For US natural gas US NATG, the “Daily Chart PP” shows a pivot point at 2.996, with the maximum support and resistance range covering $2.987–3.005/mmBtu.
★ For US copper futures COPPER, the “Daily Chart PP” shows a pivot point at 6.3467, with the maximum support and resistance range covering 6.3274–6.3664 cents/lb.
★ For US wheat WHEAT, the “Daily Chart PP” shows a pivot point at 650.7, with the maximum support and resistance range covering 645.8–654.8 cents/bushel.
For more variety interpretations, please refer to the chart. Original, customized by FX168 Financial, all rights reserved, for reference only.
Disclaimer: The content of this article solely reflects the author's opinion and does not represent the platform in any capacity. This article is not intended to serve as a reference for making investment decisions.
You may also like
Snap (SNAP.US) shares fall to over one-month lows: SPECS criticized, Meta's low-price matrix besieges, Musk shows Grok Bot growth intensifying AI FOMO
Snap closed down nearly 6% on Wednesday, marking its lowest closing price in more than a month and recording its second consecutive day of decline.
Meta's VR Hardware Expansion Benefits Unity (U.US)! The "shovel seller" logic heats up, profitability inflection point awaits earnings report validation
Meta's latest VR and AI technologies are considered important factors driving the development of Unity.
XRP Slumps Hard After Another $1.60 Rejection, BTC Slips Below $84K: Market Watch

Crypto prices
More


